How have Google and Facebook responded to the demands for increased transparency in political advertising, especially in light of the UK General Election?
Both internet giants have created online dashboards with live statistics about the political ad campaigns and the parties (or campaigners) managing them. While they are moving in the right direction some crucial data is unclear or difficult to access, which could raise questions about the accuracy of the reports.
Despite several shortcomings, we observe that the current Facebook Ad Library Report is easier to use and more informative than the Google Transparency Report.
Mini analytics dashboards
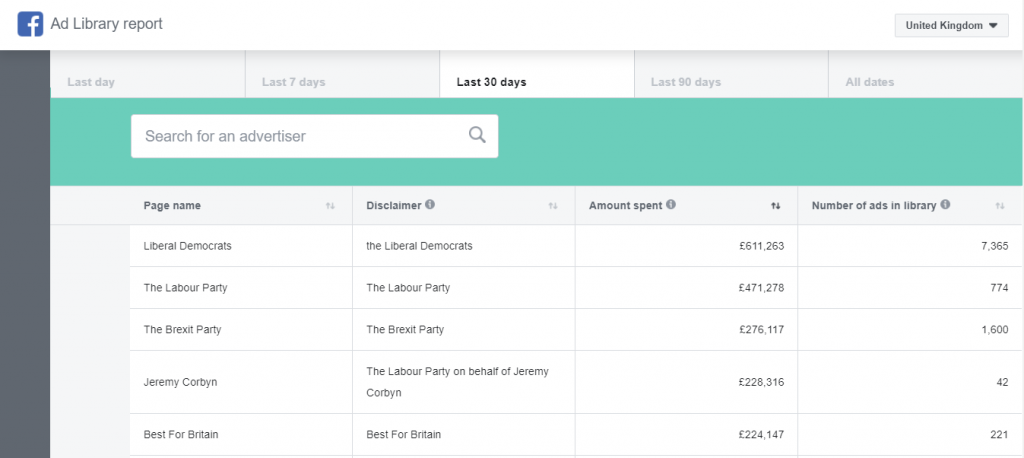
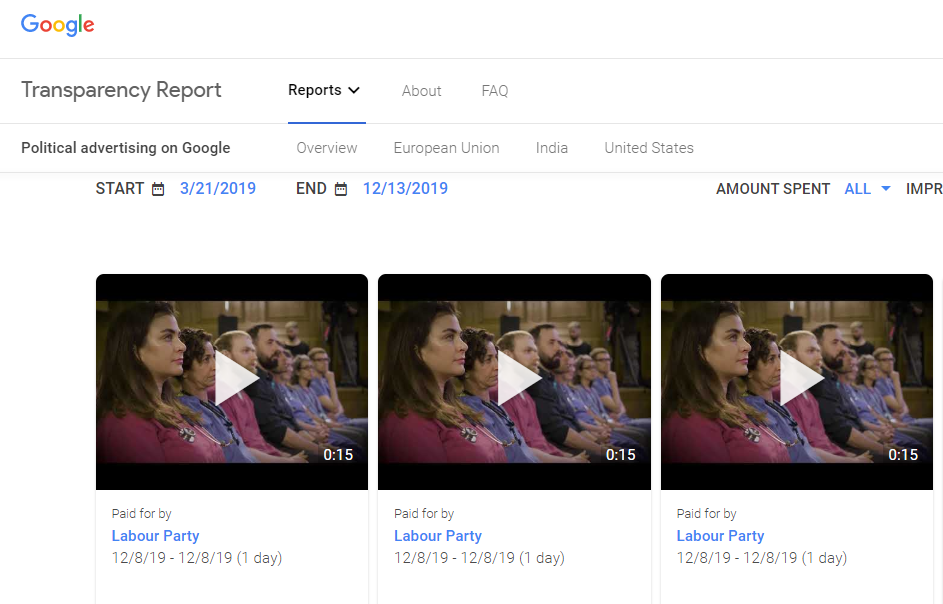
Similar to the interface of analytics tools, both Google and Facebook have searchable dashboards that allow citizens to filter by party and check who paid for which ads, as well as the actual ad copy.
Google is half a step ahead featuring sort functions to rank the top spenders or the most viewed ads. Google also has charts of the total cost by each campaign manager (or “advertiser”) over time.
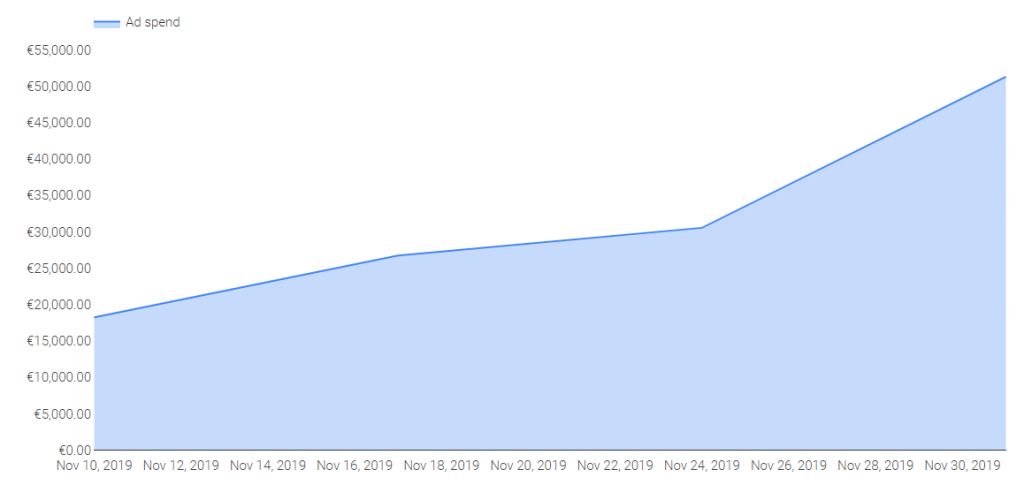
Although Facebook does not provide these yet, it still gives citizens a much easier experience to navigate and filter ad campaigns by the dates they ran on.
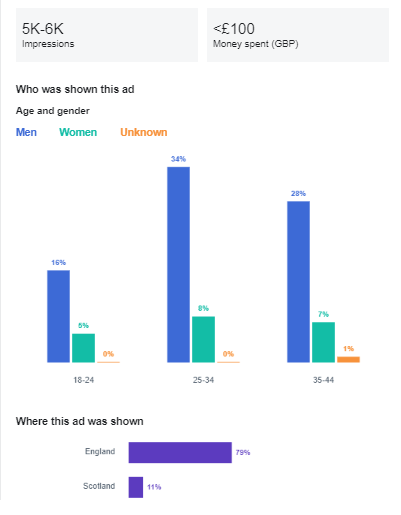
Facebook reveals which audiences and demographic groups are targeted by an ad campaign, by age, gender and country (England, Wales, Scotland, Northern Ireland).
It also allows to filter campaigns by Instagram, Audience Network and Messenger.
Unclear cost figures
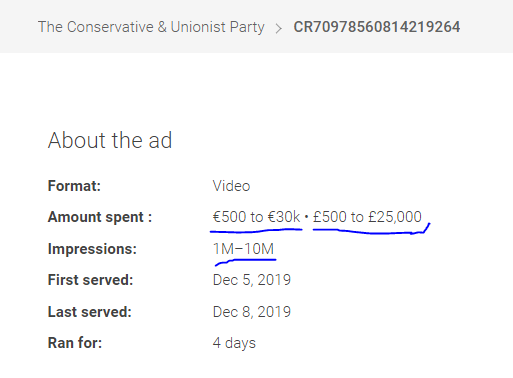
A major – and surprising – shortcoming is the lack of exact cost figures for each ad campaign. Although both platforms provide an aggregate figure for each campaign manager (or “advertiser”), when looking at each ad individually there are only broad cost ranges. The same can be said for the ad impressions (or views).
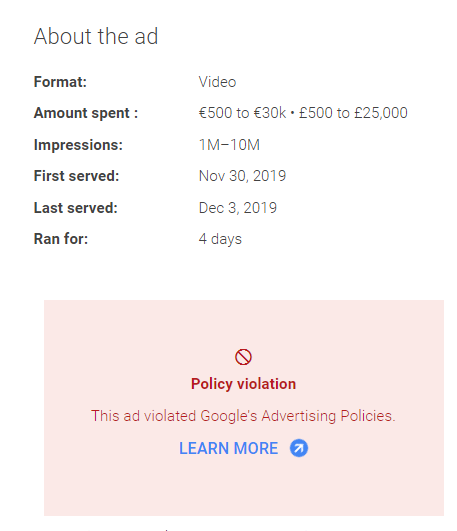
Google’s ranges for individual ads are particularly broad, e.g. “Amount spent: £500 to £25,000” or “Impressions: between 1M and 10M”.
Samples from Facebook’s report are significantly better in this regard (“£1-1.5k”).
This is surprising because of how fast and precisely both Google and Facebook display the very same data on the actual advertiser and analytics dashboards.
The information is available, but simply not disclosed.
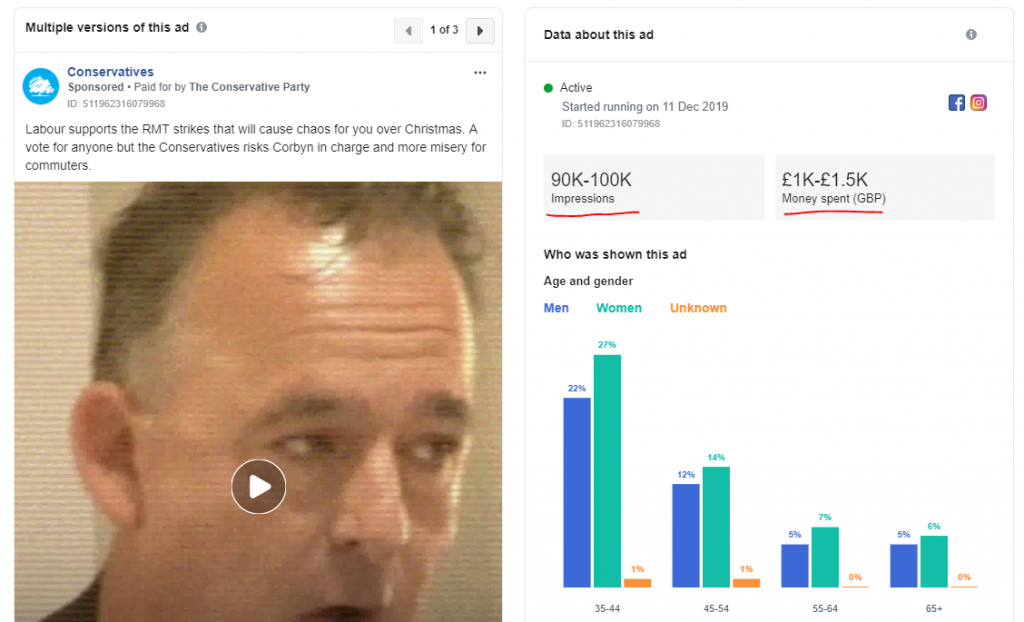
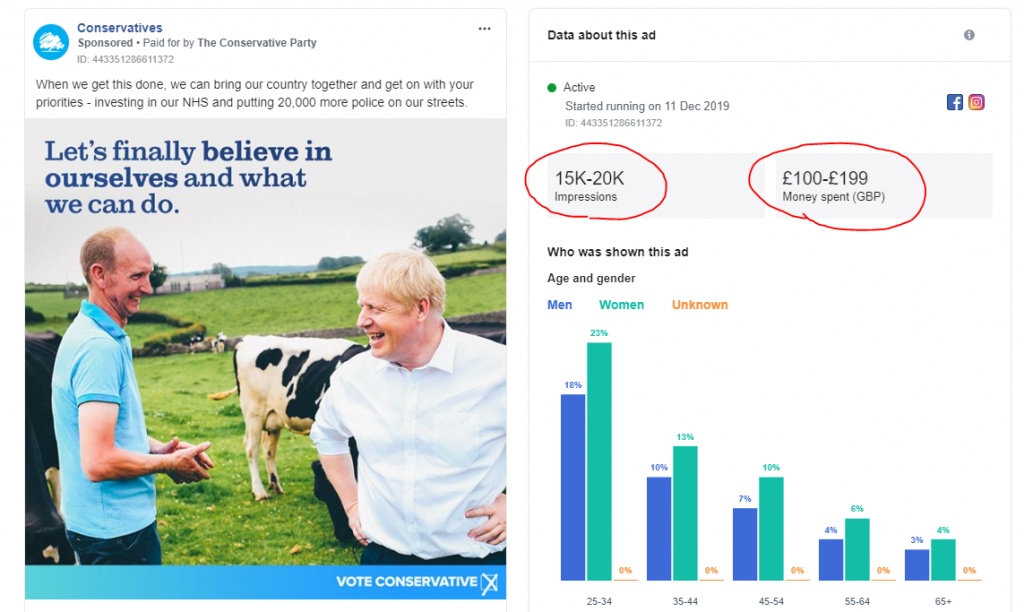
Better cost ranges on the Facebook Ad Library Report
Violating ads are hidden
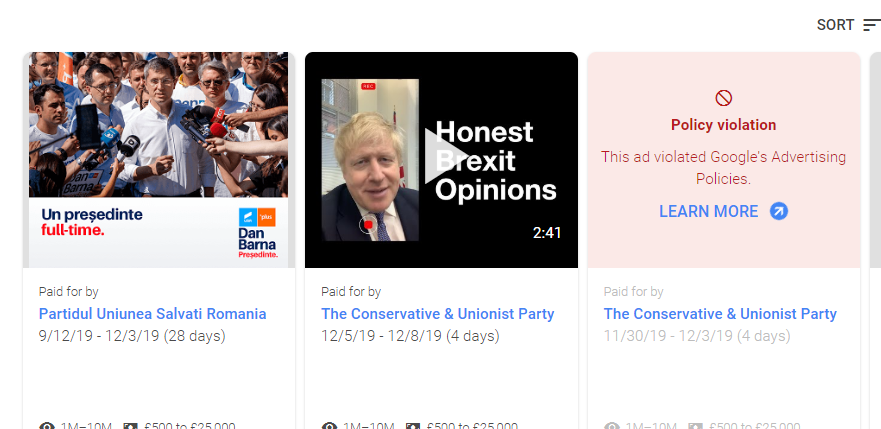
Ads that are found to violate Google’s advertising policies and disapproved are marked on the dashboard, but the actual ad text or content is hidden.
It is important for both citizens and other stakeholders to know which political ads were able to reach up to 1 million views before getting disapproved – and why.
The Facebook dashboard appears not to have or disclose such violations.
Whose campaign is that?
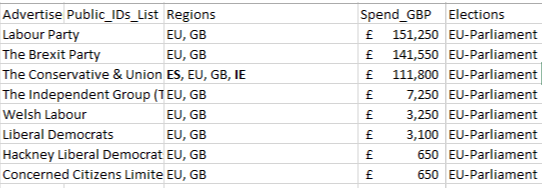
Although total cost and impression (view) figures are broken down by campaign manager (or “advertiser”), it is not straightforward to get the total spend for an entire party.
Each party can have multiple campaign managers and pages (on Facebook) and there is no built-in function to add them up.
There is a way around using data exports, but it is time-consuming and the burden should not be on the citizens, especially the non-tech-savvy.
No common criteria for “political ads”
The Facebook report moreover includes all ads “about social issues, elections or politics”, including independent campaigns such as Remain United, but also other campaigns that discuss wider social issues.
While this may also help identify irregular or misleading ads by those who are not officially linked to a party, it may also create noise – examples include ads selling jumpers with Trump memes.
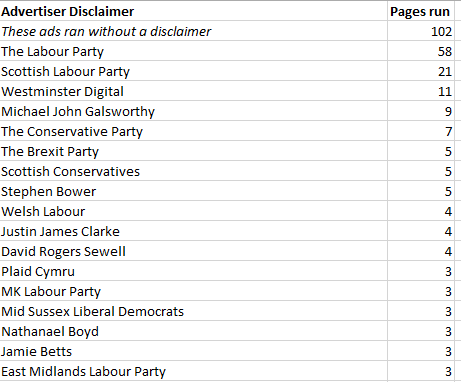
It should be noted that as of present 102 Facebook pages ran ads “without a disclaimer”, meaning they either don’t have or didn’t disclose a link to a political party or campaign group.
Google’s report appears to capture a more narrow group of ads, but includes an interesting outlier: Dan Barna, a candidate for the 2019 Romanian presidential election, likely targeting his fellow citizens residing in the UK!

Incomplete data exports
Facebook is the clear winner here. Even if both companies’ reports allow downloading source data in Excel/CSV format, Google only provides a single bundle of datasets with worldwide data from a static period or past elections – no current ads are included.
For certain metrics, such as keywords, Google discloses data only for the US election.
In contrast, the Facebook report allows one to export any desired country breakdown for different periods. It crucially includes currently live ad campaigns. This makes any further analysis easier.
The only feature Google offers that Facebook doesn’t is the ability to check if a political party has also advertised abroad, e.g. the Conservative Party advertising in Spain and Ireland.

Conclusion & recommendations
Over £17 million have been spent in the UK on Facebook Ads categorised as “about social issues, elections or politics” since October 2018. Adding the regulatory scrutiny and backlash faced by the social media company, it is comprehensible that Facebook is taking greater measures towards meeting the transparency demands.
Nevertheless, both Facebook and Google need to work on making their data more accessible and easier to understand – especially with regards to disclosing policy-violating ads and accurate cost figures.
On top of that, we recommend that they provide:
- Clearer marking of political ads when they are displayed to users, especially Facebook Ads which are “without a disclaimer”;
- A note about why an ad is considered a “political ad” (based on a list of reasons);
- More location granularity e.g. data by city or constituency rather than only country;
- Top keywords for which an ad appeared (on Google).
About Worldacquire
Worldacquire is a political tech firm in London providing digital strategy, advertising and analytics solutions. We managed election campaigns in Hong Kong, contributing to the 2019 landslide pro-democracy victory, and in Thailand, supporting one of the country’s first LGBTQ+ candidates, using technology to cut through electoral red tape. At the United Nations Internet Governance Forum, we called for a fair and balanced regulation of online political advertising and greater transparency of other sources of digital manipulation. We work with governments, think tanks, intergovernmental organizations and social ventures to understand and apply digital technology, A.I. and algorithms effectively and ethically.
